안녕하세요 친구들, 몇 주 전에 리액트를 활용해 바이낸스의 무료 웹소켓 API를 활용한 실시간 가격 차트를 만들었습니다.
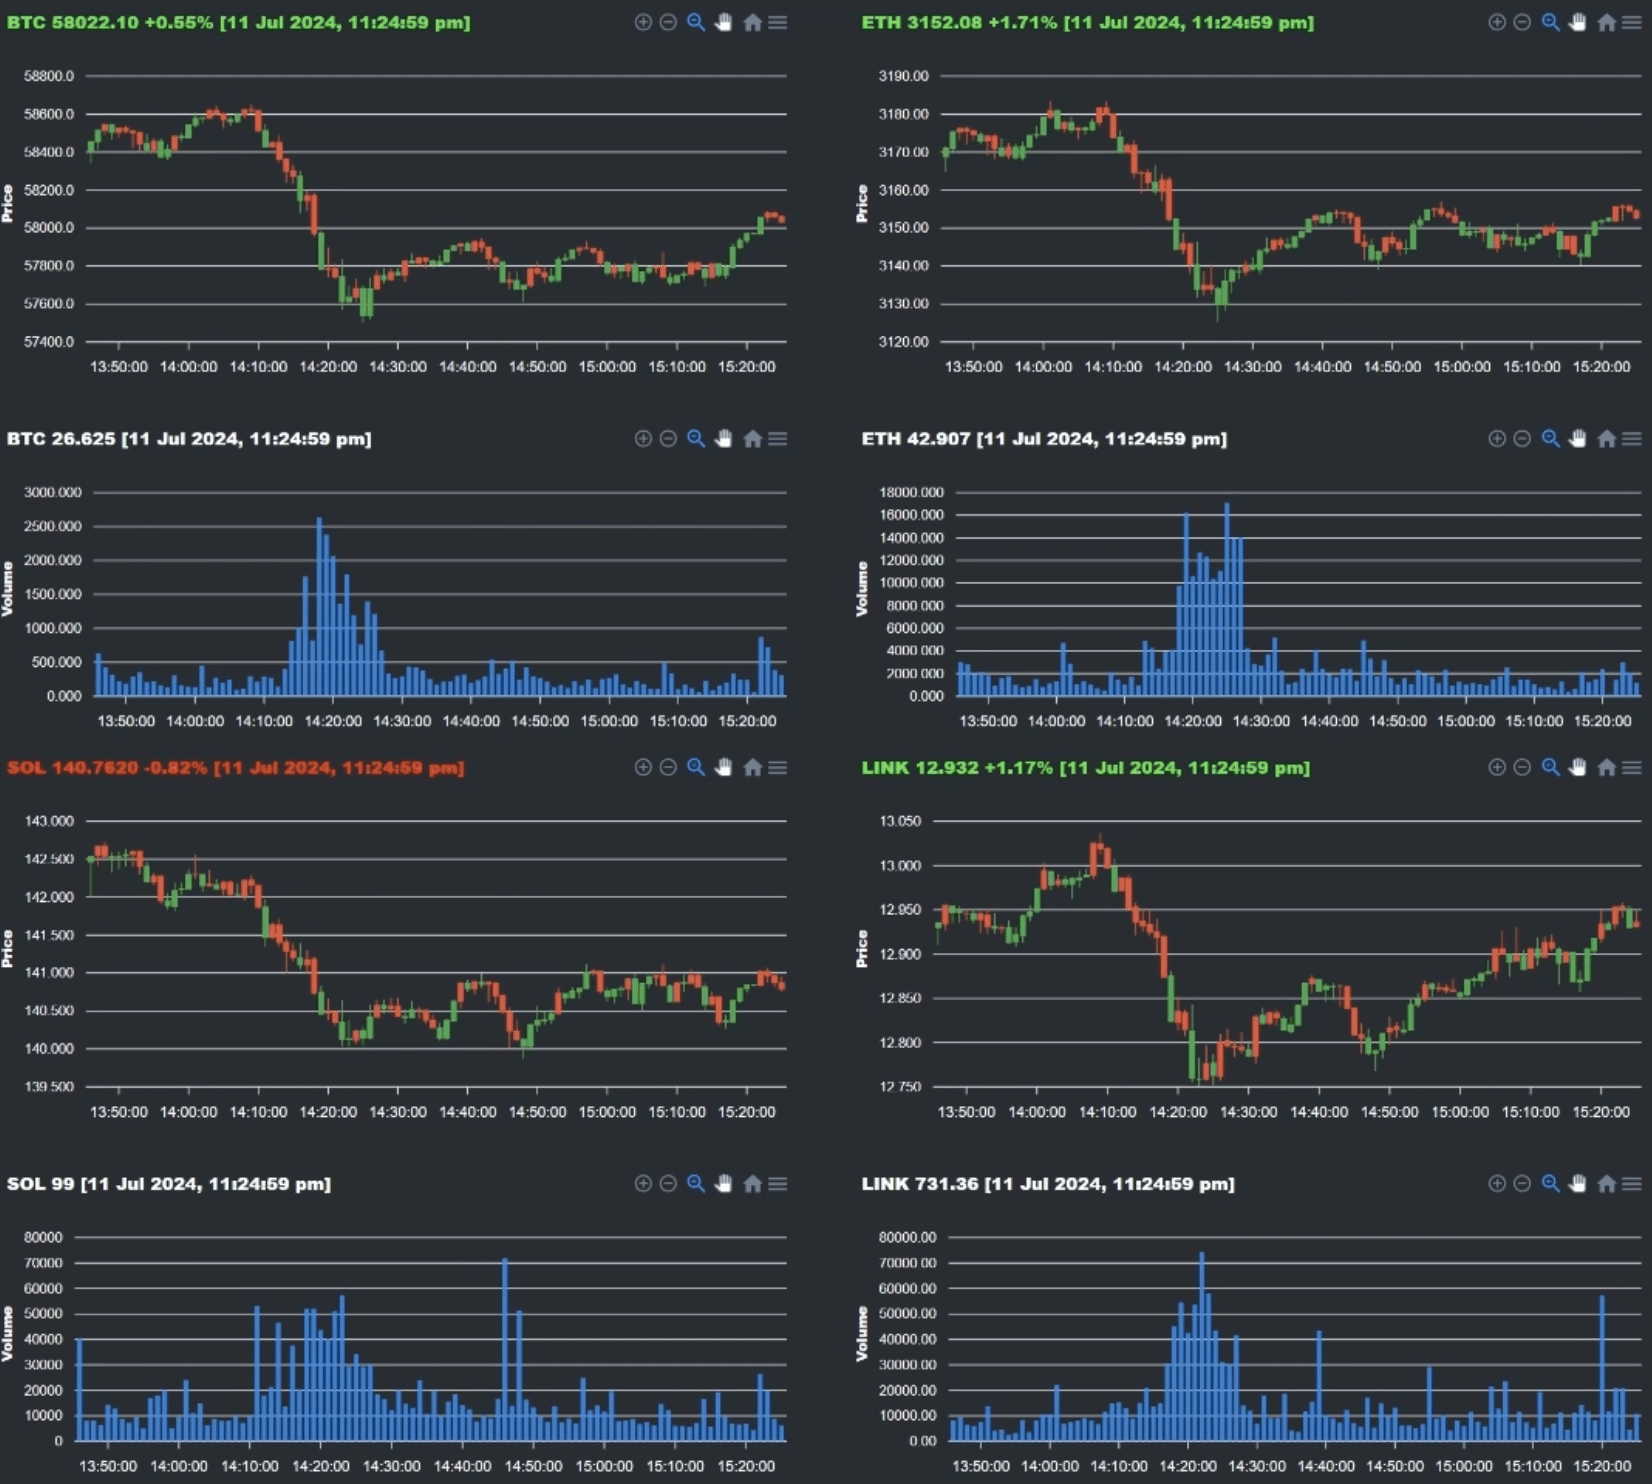
그 이후로 한 번 더 발전시켜 하나가 아닌 여러 토큰을 수용하는 간단한 암호화폐 가격 및 거래량 대시보드를 만들었습니다.
본 문서는 이전 글(링크 참조)에서 논의한 개념을 확장하므로 기본 내용을 여기서 다시 언급하지는 않겠습니다. 더 알고 싶으시다면, 이전 글부터 시작하는 것을 추천합니다 :)
여기서 다룰 내용은 차트 로직을 자체적인 React 컴포넌트로 추상화한 방법입니다. 이 컴포넌트인 IntradayChart는 코인 티커를 인수로 받아 실시간 가격 및 거래량 차트를 렌더링할 수 있습니다. 이를 통해 몇 줄의 코드로 IntradayChart의 여러 인스턴스를 쉽게 생성할 수 있습니다.
import './App.css';
import IntradayChart from './IntradayChart';

function App() {
  const coins = ['BTC', 'ETH', 'SOL', 'LINK', 'ADA', 'DOT']
  const coinDivs = coins.map((coin, index) => (
    <IntradayChart coin={coin} />
  ))

  return (
    <div className="App">
      <div className="coin-container" >
        {coinDivs}
      </div>
    </div>
  );
}

export default App;
IntradayChart 컴포넌트 내에서 웹소켓 및 데이터 변환 로직을 캡슐화함으로써 관심사 분리 원칙을 준수합니다. 이를 통해 우리의 App 컴포넌트는 차트 표시에만 집중하고 복잡한 작업을 수행하는 번거로움 없이 코드를 깔끔하게 유지할 수 있습니다.
(IntradayChart의 전체 코드는 별지에 포함될 예정입니다)
프롭스에 따라 동적으로 API URL 할당하기
이전에 언급했듯이, 우리는 IntradayChart 컴포넌트에 전달된 코인에 따라 차트가 의존하도록 만들어야 합니다. 예를 들어:
<IntradayChart coin='ETH' />
위의 코드 라인은 ETHUSDT의 가격과 거래량에 해당하는 차트를 렌더링해야 합니다.
앞서 설명한 내용은 React 컴포넌트에 내장된 props 메커니즘을 통해 이루어집니다. 위의 코드 라인에서는 coin=ETH를 인수로 전달했는데, 이를 액세스하는 방법은 IntradayChart 컴포넌트 내부에서 props.coin을 호출하는 것과 같이 간단합니다.
function IntradayChart(props) {
    console.log(props.coin)
}
이전 포스트에서 BTC의 실시간 가격을 가져오기 위해 URL을 하드코딩한 것과는 달리, 이번에는 useRef 훅을 먼저 선언하고 그 값을 props.coin에 할당함으로써 동적으로 이를 수행할 수 있습니다.
const token = useRef(null)
token.current = props.coin
그 후에 우리는 token.current를 사용하여 웹소켓 URL을 구성할 수 있습니다. 예를 들어:
// 대신에 이렇게:
const wsUrl = `wss://fstream.binance.com/stream?streams=btcusdt@kline_1m`

// 이렇게 할 수 있습니다:
const wsUrl = `wss://fstream.binance.com/stream?streams=${token.current.toLowerCase()}usdt@kline_1m
웹소켓에 연결하기
이제부터는 이전 포스트에서 다룬 내용과 매우 비슷합니다.
// WebSocket 설정을 useEffect 훅 내에 포함하는 것이 좋습니다. 이렇게 하면 컴포넌트가 마운트될 때 연결을 설정하고 언마운트될 때 정리하여 메모리 누수와 불필요한 재연결을 방지할 수 있습니다.
useEffect(() => {
    const stream = `${token.current.toLowerCase()}usdt@kline_1m`;
    const headers = { "method": "SUBSCRIBE", "params": [stream], "id": 1 };
    const wsUrl = `wss://fstream.binance.com/stream?streams=${stream}`;
    webSocket.current = new WebSocket(wsUrl);

    webSocket.current.onopen = () => {
        console.log("Connection Established!");
        webSocket.current.send(JSON.stringify(headers));
    };

    webSocket.current.onclose = () => {
        console.log('Closing websocket')
    }

    return () => {
        // 컴포넌트가 언마운트될 때 WebSocket을 닫아주어야 메모리 누수가 발생하지 않습니다.
        webSocket.current.close();
    }
}, []); // useEffect에 여기에 들어가는 항목은 컴포넌트가 재렌더링되도록 만듭니다.
위의 코드 스니펫을 사용하여 token.current를 사용하여 스트림 문자열을 작성하고, 그 후 headers 및 wsUrl을 사용하여 바이낸스 API 웹소켓을 구독할 수 있습니다.
차트 업데이트하기
웹소켓이 설정되면, 이후 useEffect 블록을 사용하여 가격과 거래량 정보를 업데이트합니다. 가격과 거래량 정보는 타임스탬프를 Key로 가격 또는 거래량을 Value로 가지는 고유한 쌍들을 저장합니다.
useEffect(() => {
    console.log("prices", prices)
    console.log("volumes", volumes)
    // 웹소켓으로부터 전달된 데이터가 포함된 이벤트입니다
    webSocket.current.onmessage = (event) => {
        // useEffect 훅을 트리거하기 위해 setWsMessage를 설정해야 합니다.
        setWsMessage(JSON.parse(event.data));
        const response = JSON.parse(event.data);
        console.log(response);
        var data = response.data;
        // 데이터가 있는지와 series.length가 0보다 큰지 확인하여 초기 fetch 요청을 통해 시리즈가 설정된 후에만 데이터가 업데이트되도록 조건 설정합니다
        if (!!data && series.length > 0) {

            const price_data = data.k;
            const d = new Date(price_data.T);
            console.log(d);
            console.log("msg_price_data", d, [price_data.o, price_data.h, price_data.l, price_data.c]);

            prices[d] = [price_data.o, price_data.h, price_data.l, price_data.c];
            console.log("newly_set_prices", prices);

            volumes[d] = price_data.v;

            // 데이터 포인트를 늘리면 성능이 저하되는 것을 확인하여 데이터 포인트를 100개로 제한하기로 결정했습니다.
            // 계속 커지는 차트가 아니라 100분 기간의 롤링 창이 있는 차트를 가지게 됩니다.
            if (Object.keys(volumes).length > 100) {
                delete volumes[Object.keys(volumes)[0]];
            }
            setVolumeSeries([{ data: Object.keys(volumes).map(time => ({ x: new Date(time), y: volumes[time] })) }]);

            if (Object.keys(prices).length > 100) {
                delete prices[Object.keys(prices)[0]];
            }
            setPriceSeries([{ data: Object.keys(prices).map(time => ({ x: new Date(time), y: prices[time] })) }])
        }
    }

}, [wsMessage]);
참조를 위해, prices 및 volumes 객체의 구조는 다음과 같아야 합니다:
prices
위의 코드 조각은 시간별로 기록된 암호화폐 거래 데이터를 보여줍니다. priceSeries와 volumeSeries 함수를 통해 차트 데이터를 업데이트하기 전에 이 데이터들이 최종 구조로 매핑됩니다.
setVolumeSeries([{ data: Object.keys(volumes).map(time => ({ x: new Date(time), y: volumes[time] })) }])
setPriceSeries([{ data: Object.keys(prices).map(time => ({ x: new Date(time), y: prices[time] })) }])
이때 가격과 거래량 데이터를 업데이트할 때 아래 조건이 적용된 것을 알아챌 수 있을 것입니다.
if (Object.keys(volumes).length > 100) {
     delete volumes[Object.keys(volumes)[0]];
}
이를 개발하는 과정에서, 특정 임계점을 초과하여 분봉의 수가 많아지면 앱의 성능이 상당히 저하되는 것을 관찰했습니다. 이에 대응하기 위해, 지속적으로 증가하는 봉차트를 유지하는 대신 100분의 롤링 윈도우를 선택하여 더 부드러운 성능을 보장했습니다.
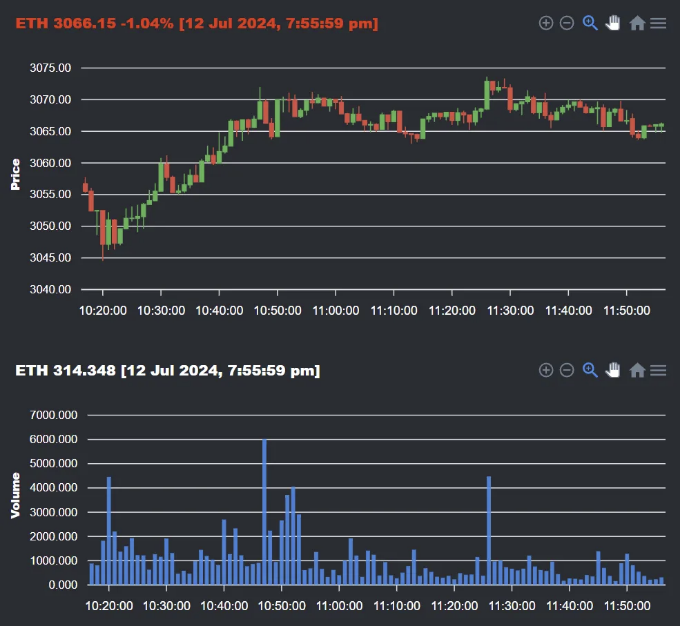
차트 제목 업데이트 중
아마도 주목하신 것 중 하나는 ticking chart titles입니다. 이들은 암호화폐 토큰, 최신 가격/거래량, 일중 수익률, 그리고 현재 분 바의 타임스탬프를 표시하고 있습니다.
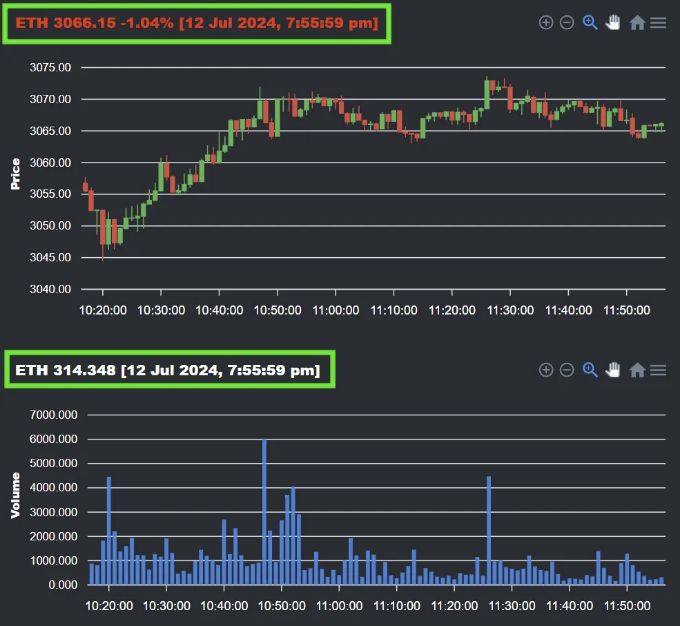
이들은 기존 차트 데이터를 업데이트하는 훅과 별개로 업데이트됩니다. 우리는 가격 차트 헤더에 대한 옵션과 거래량 차트 헤더에 대한 volumeOptions으로 이를 정의합니다.
이제 한번 감을 잡아보겠습니다.
우리의 후크들은 다음과 같습니다:
╔═══════════════╦══════════════════╦═════════════════════╗
║     후크       ║ 업데이트 함수     ║        목적         ║
╠═══════════════╬══════════════════╬═════════════════════╣
║ priceSeries   ║ setPriceSeries   ║ 가격 차트 데이터     ║
║ volumeSeries  ║ setVolumeSeries  ║ 거래량 차트 데이터   ║
║ priceOptions  ║ setPriceOptions  ║ 가격 차트 제목      ║
║ volumeOptions ║ setVolumeOptions ║ 거래량 차트 제목    ║
╚═══════════════╩══════════════════╩═════════════════════╝
이제, 이전 글에서 기억해봐 주셨다면, react-apexcharts의 Chart 컴포넌트는 기본 데이터를 위해 필요한 객체인 series를 입력으로 받습니다. 또한 다른 options라는 인수를 받습니다 — 여기에는 차트 형식, 크기, 배경색, 축 레이블 등과 관련된 속성을 저장합니다.
<Chart options={priceOptions} series={priceSeries} type="candlestick" height={300}/>
이 options 인수 내에서 우리는 ticking chart 제목을 생성하기 위해 헤더 속성을 전달할 것입니다.
이를 어떻게 할까요? 예상대로, useState 를 사용하여 훅과 그들의 업데이트 함수를 초기화합니다 :
const [priceOptions, setPriceOptions] = useState({
    chart: {
        type: 'candlestick',
        height: 350,
        background: "#282c34",
        foreColor: '#ffffff',
        fill: '#282c34',
    },
    xaxis: {
        type: 'datetime'
    },
    yaxis: {
        title: {
            text: 'Price'
        },
        tooltip: {
            enabled: true
        }
    }
});

const [volumeOptions, setVolumeOptions] = useState({
    chart: {
        type: 'bar',
        height: 350,
        background: "#282c34",
        foreColor: '#ffffff',
    },
    dataLabels: {
        enabled: false
    },
    xaxis: {
        type: 'datetime'
    },
    yaxis: {
        title: {
            text: 'Volume'
        },
        tooltip: {
            enabled: true
        },
    }
});
이러한 초기화된 옵션에서 빠진 것은 차트 제목입니다. 이것은 의도적인 결정이며 웹소켓 스트림에서 데이터를 가져와 제목 속성을 채울 때에만 사용할 것입니다.
우리 차트 제목을 업데이트하려면, 앞서 작성한 useEffect 블록에 코드를 추가하면 됩니다:
useEffect(() => {
    console.log("prices", prices);
    console.log("volumes", volumes);
    // 웹소켓에서 전송된 데이터가 포함된 이벤트
    webSocket.current.onmessage = (event) => {
        // useEffect 훅을 트리거하기 위해 setWsMessage를 설정해야 함
        setWsMessage(JSON.parse(event.data));
        const response = JSON.parse(event.data);
        console.log(response);
        var data = response.data;
        // 데이터가 존재하고 시리즈가 설정된 후에만 데이터를 업데이트할 수 있도록 series.length > 0 조건을 설정합니다
        if (!!data && series.length > 0) {

            const price_data = data.k;
            const d = new Date(price_data.T);
            console.log(d);
            console.log("msg_price_data", d, [price_data.o, price_data.h, price_data.l, price_data.c]);

            prices[d] = [price_data.o, price_data.h, price_data.l, price_data.c];
            console.log("newly_set_prices", prices);

            volumes[d] = price_data.v;

            // 데이터 포인트를 증가시키는 것이 성능을 저하시킨다는 것을 깨달았기에 데이터 포인트를 100개로 제한하기로 결정했습니다
            // 계속 커지는 차트 대신 100분간의 롤링 창을 가지게 됩니다
            if (Object.keys(volumes).length > 100) {
                delete volumes[Object.keys(volumes)[0]];
            }
            setVolumeSeries([{ data: Object.keys(volumes).map(time => ({ x: new Date(time), y: volumes[time] })) }]);

            if (Object.keys(prices).length > 100) {
                delete prices[Object.keys(prices)[0]];
            }
            setPriceSeries([{ data: Object.keys(prices).map(time => ({ x: new Date(time), y: prices[time] })) }]);

            // 차트 제목 업데이트
            const dayRet = ((price_data.c - openPrice.current) / openPrice.current * 100).toFixed(2);
            const retStr = dayRet > 0 ? `+${dayRet}` : `${dayRet}`;
            const color = dayRet > 0 ? 'lime' : 'red';
            const newPriceTitle = `${token.current} ${price_data.c} ${retStr}% [${d.toLocaleString("en-GB", {
                day: "numeric",
                month: "short",
                year: "numeric",
                hour: "numeric",
                minute: "2-digit",
                second: "2-digit",
                hour12: true
            })}]`;
            console.log("header", newPriceTitle);
            setPriceOptions(prevOptions => ({ ...prevOptions, title: { text: newPriceTitle, align: 'left', style: { color: color } } }));

            const newVolumeTitle = `${token.current} ${price_data.v} [${d.toLocaleString("en-GB", {
                day: "numeric",
                month: "short",
                year: "numeric",
                hour: "numeric",
                minute: "2-digit",
                second: "2-digit",
                hour12: true
            })}]`;
            setVolumeOptions(prevOptions => ({ ...prevOptions, title: { text: newVolumeTitle, align: 'left' } }));
        }
    }

}, [wsMessage])
과거 데이터 포인트로 차트 초기화
차트에 일부 과거 데이터를 사용하여 초기화하면 처음부터 멋지게 보일 것 같아요.
간단한 fetch 요청을 만들고 또 다른 useEffect 블록 내부에 있는 가격 및 거래량 객체를 채우는 방식으로 이 작업을 수행할 수 있습니다:
// 마지막 100개의 1분 데이터 포인트로 가격 및 거래량을 초기화
useEffect(() => {
    const tsUrl = `https://fapi.binance.com/fapi/v1/klines?symbol=${token.current}USDT&interval=1m&limit=100`
    const start_prices = {}
    const start_volumes = {}
    fetch(tsUrl)
        .then(res => res.json())
        .then(data => {
            data.forEach(d => {
                const time = new Date(d[0])
                start_prices[time] = [d[1], d[2], d[3], d[4]]
                start_volumes[time] = d[5]
            });
            console.log("start_prices", start_prices)
            setPrices(start_prices)
            setVolumes(start_volumes)
        })
}, [])
JSX 반환 값 구성
지금까지의 노력은 div 컴포넌트를 만들어 가격 및 거래량 차트를 담을 수 있도록 하려는 데 중점을 두었습니다. 그래서 IntradayChart 컴포넌트가 모든 작업의 끝에서 반환하는 div 블록은 아래와 같습니다.
return (
    <div className="IntradayChart" style={ width: '50%', height: '600px' }>
        <div id={`${token.current.toLowerCase()}-price-chart`} className='crypto-apex-charts' >
            <Chart options={priceOptions} series={priceSeries} type="candlestick"  height={300}/>
        </div>
        <div id={`${token.current.toLowerCase()}-volume-chart`} className='crypto-apex-charts' >
            <Chart options={volumeOptions} series={volumeSeries} type="bar" height={250}/>
        </div>
    </div>
);
위 코드에서 볼 수 있듯이, 우리는 지금까지 다룬 hooks(priceOptions, priceSeries, volumeOptions, volumeSeries)를 Chart 컴포넌트의 입력값으로 사용하고 있습니다.
이제 맨 위로 돌아가서 IntradayChart 컴포넌트를 우리의 주요 App 컴포넌트에 import하고 완성했습니다. 여러분만의 암호화폐 대시보드를 만들었습니다!
절대 명확성을 위해 코드 스니펫을 여기에 다시 붙여 넣습니다:
import './App.css';
import IntradayChart from './IntradayChart';

function App() {
  const coins = ['BTC', 'ETH', 'SOL', 'LINK', 'ADA', 'DOT']
  const coinDivs = coins.map((coin, index) => (
    <IntradayChart coin={coin} />
  ))

  return (
    <div className="App">
      <div className="coin-container" >
        {coinDivs}
      </div>
    </div>
  );
}

export default App;
안녕하세요! 코드를 올려주셔서 감사합니다. 행복한 코딩되세요!
부록
import './App.css';
import { useEffect, useState, useRef } from 'react';
import Chart from 'react-apexcharts';


function IntradayChart(props) {
    var cryptoPrices;
    var start_time;
    // useRef를 사용하여 useEffect 블록 내에서 특히 사용할 값들을 저장합니다.

    const token = useRef(null)
    token.current = props.coin

    const openPrice = useRef(null)

    const cryptoUrl = `https://fapi.binance.com/fapi/v1/klines?symbol=${token.current}USDT&interval=1d&limit=1`
    // 시작 가격 및 시간은 가격 차트의 헤더에 사용하기 위해 일일 데이터에서 가져옵니다.
    console.log("cryptoUrl", cryptoUrl)
    fetch(cryptoUrl)
        .then(res => res.json())
        .then(data => {
            cryptoPrices = data[0];
            openPrice.current = cryptoPrices[1]
            start_time = new Date(cryptoPrices[0])
        })
        .then(() => console.log("open", openPrice.current, "start_time", start_time));


    const [priceOptions, setPriceOptions] = useState({
        chart: {
            type: 'candlestick',
            height: 350,
            background: "#282c34",
            foreColor: '#ffffff',
            fill: '#282c34',
        },
        xaxis: {
            type: 'datetime'
        },
        yaxis: {
            title: {
                text: 'Price'
            },
            tooltip: {
                enabled: true
            }
        }
    });

    const [volumeOptions, setVolumeOptions] = useState({
        chart: {
            type: 'bar',
            height: 350,
            background: "#282c34",
            foreColor: '#ffffff',
        },
        dataLabels: {
            enabled: false
        },
        xaxis: {
            type: 'datetime'
        },
        yaxis: {
            title: {
                text: 'Volume'
            },
            tooltip: {
                enabled: true
            },
        }
    });

    const [wsMessage, setWsMessage] = useState("");
    const [priceSeries, setPriceSeries] = useState([{ data: [] }]);
    const [volumeSeries, setVolumeSeries] = useState([{ data: [] }]);
    // useRef는 웹소켓 연결을 저장하여 웹소켓 연결이 업데이트될 때마다 컴포넌트가 다시 렌더링되지 않도록 합니다.
    const webSocket = useRef(null);
    // 가격과 거래량은 고유한 타임스탬프를 키로 사용하고 값은 가격 및 거래량 데이터입니다.
    const [prices, setPrices] = useState({})
    const [volumes, setVolumes] = useState({})

    // 웹소켓 연결 및 웹소켓 메시지를 위한 useEffect 별도로 분리해야하며 그렇지 않으면 웹소켓 메시지가 업데이트될 때마다
    // 웹소켓 연결이 다시 설정되어 계속 닫히고 다시 연결됩니다.

    // 웹소켓 설정은 useEffect 훅 내에 좋은 실천사례입니다. 이를 통해 컴포넌트가 마운트될 때 연결을 설정하고
    // 언마운트될 때 정리하여 메모리 누수와 불필요한 재연결을 방지할 수 있습니다.
    useEffect(() => {
        const stream = `${token.current.toLowerCase()}usdt@kline_1m`
        const headers = { "method": "SUBSCRIBE", "params": [stream], "id": 1 }
        const wsUrl = `wss://fstream.binance.com/stream?streams=${stream}`
        webSocket.current = new WebSocket(wsUrl);

        webSocket.current.onopen = () => {
            console.log("Connection Established!");
            webSocket.current.send(JSON.stringify(headers));
        };

        webSocket.current.onclose = () => {
            console.log('Closing websocket')
        }

        return () => {
            // 컴포넌트 마운트 해제 시 웹소켓을 닫아야합니다. 그렇지 않으면 백그라운드에서 계속 실행됩니다.
            webSocket.current.close()
        }
    }, [])

    useEffect(() => {
        console.log("prices", prices)
        console.log("volumes", volumes)
        // 이벤트는 웹소켓에서 전송된 데이터를 포함합니다.
        webSocket.current.onmessage = (event) => {
            // useEffect 훅을 트리거하기 위해 setWsMessage를 설정해야합니다.
            setWsMessage(JSON.parse(event.data));
            const response = JSON.parse(event.data);
            console.log(response);
            var data = response.data
            // priceSeries가 설정된 상태일 때 데이터를 업데이트하는지 확인합니다.
            if (!!data && priceSeries.length > 0) {

                const price_data = data.k
                const d = new Date(price_data.T)
                console.log(d)
                console.log("msg_price_data", d, [price_data.o, price_data.h, price_data.l, price_data.c])

                prices[d] = [price_data.o, price_data.h, price_data.l, price_data.c]
                console.log("newly_set_prices", prices)

                volumes[d] = price_data.v

                // 데이터 포인트 증가로 인한 성능 저하를 인지하여 데이터 포인트를 100개로 제한합니다.
                if (Object.keys(volumes).length > 100) {
                    delete volumes[Object.keys(volumes)[0]];
                }
                setVolumeSeries([{ data: Object.keys(volumes).map(time => ({ x: new Date(time), y: volumes[time] })) }])

                if (Object.keys(prices).length > 100) {
                    delete prices[Object.keys(prices)[0]];
                }
                setPriceSeries([{ data: Object.keys(prices).map(time => ({ x: new Date(time), y: prices[time] })) }])

                // 차트 타이틀 업데이트
                const dayRet = ((price_data.c - openPrice.current) / openPrice.current * 100).toFixed(2)
                const retStr = dayRet > 0 ? `+${dayRet}` : `${dayRet}`
                const color = dayRet > 0 ? 'lime' : 'red'
                const newPriceTitle = `${token.current} ${price_data.c} ${retStr}% [${d.toLocaleString("en-GB", {
                    day: "numeric",
                    month: "short",
                    year: "numeric",
                    hour: "numeric",
                    minute: "2-digit",
                    second: "2-digit",
                    hour12: true
                })}]`
                console.log("header", newPriceTitle);
                setPriceOptions(prevOptions => ({ ...prevOptions, title: { text: newPriceTitle, align: 'left', style: { color: color } } }))

                const newVolumeTitle = `${token.current} ${price_data.v} [${d.toLocaleString("en-GB", {
                    day: "numeric",
                    month: "short",
                    year: "numeric",
                    hour: "numeric",
                    minute: "2-digit",
                    second: "2-digit",
                    hour12: true
                })}]`
                setVolumeOptions(prevOptions => ({ ...prevOptions, title: { text: newVolumeTitle, align: 'left' } }))

            }
        }

    }, [wsMessage])

    return (
        <div className="IntradayChart" style={{ width: '50%', height: '600px' }}>
            <div id={`${token.current.toLowerCase()}-price-chart`} className='crypto-apex-charts' >
                <Chart options={priceOptions} series={priceSeries} type="candlestick"  height={300}/>
            </div>
            <div id={`${token.current.toLowerCase()}-volume-chart`} className='crypto-apex-charts' >
                <Chart options={volumeOptions} series={volumeSeries} type="bar" height={250}/>
            </div>
        </div>
    );
}

export default IntradayChart;